Know when to buy, how much to stock, how to protect your margin.
Raw materials can be up to 64% of your cost of goods, and they're volatile. Oil and Bred forecasts your solvent prices, reads the events that move them and tells you the right move — with measured reliability, not guesswork.
Check a solvent price
Query the database in real time: type a product and see price, forecast and signal.
Try it live
Real, dynamic data from our engine, updated daily. Pick a solvent and see forecast, reliability, price, Brent and the news moving the market.
Everything you need to buy better
Not a price database: a tool that turns prices, markets and events into a purchasing decision.
Real €/kg B2B price
The actual price of your solvents from Business Analytiq — not a generic index. Monthly history since 2015.
Event-aware forecast
AI reads the news (wars, refinery outages, sanctions) and weighs them on the price, with crude vs margin sign.
Buy · Wait · Stock up
A clear signal for each raw material, with the threshold at which the decision flips.
Measured reliability
Every forecast has a reliability % from the backtest on the REAL price: you know how much to trust it.
Daily report
The analyst that never sleeps: every morning situation, actions and risks, on your verified numbers.
Guided purchase
A wizard that, given need and deadline, closes with a reasoned Go/No-Go and the sources.
Margin & cash impact
Stress-test on your accounts: how a rise/fall moves profit, inventory and liquidity.
Proprietary indices (NEPI, PGI)
How long an event stays "alive" on the price and how many days it pays to buy ahead.
Inside Oil and Bred
Not just words: here's what you see every day, how the number is built and why you can rely on it.
What we do
We forecast your solvent prices and tell you the move — buy, wait or stock up. Not a price database: a purchasing decision on your own numbers.
How we do it
We start from the real B2B €/kg price, cross it with the markets (Brent, gas, FX) and with events read by AI (wars, refinery outages, sanctions), weighted with a crude/margin sign. Every forecast is validated by walk-forward backtest on the real price.
Why we're better
Real price, not an index. Signed events, not a scalar that cancels out. Measured reliability, not a promise. Proprietary indices (NEPI, PGI) and self-calibration that improves every day.
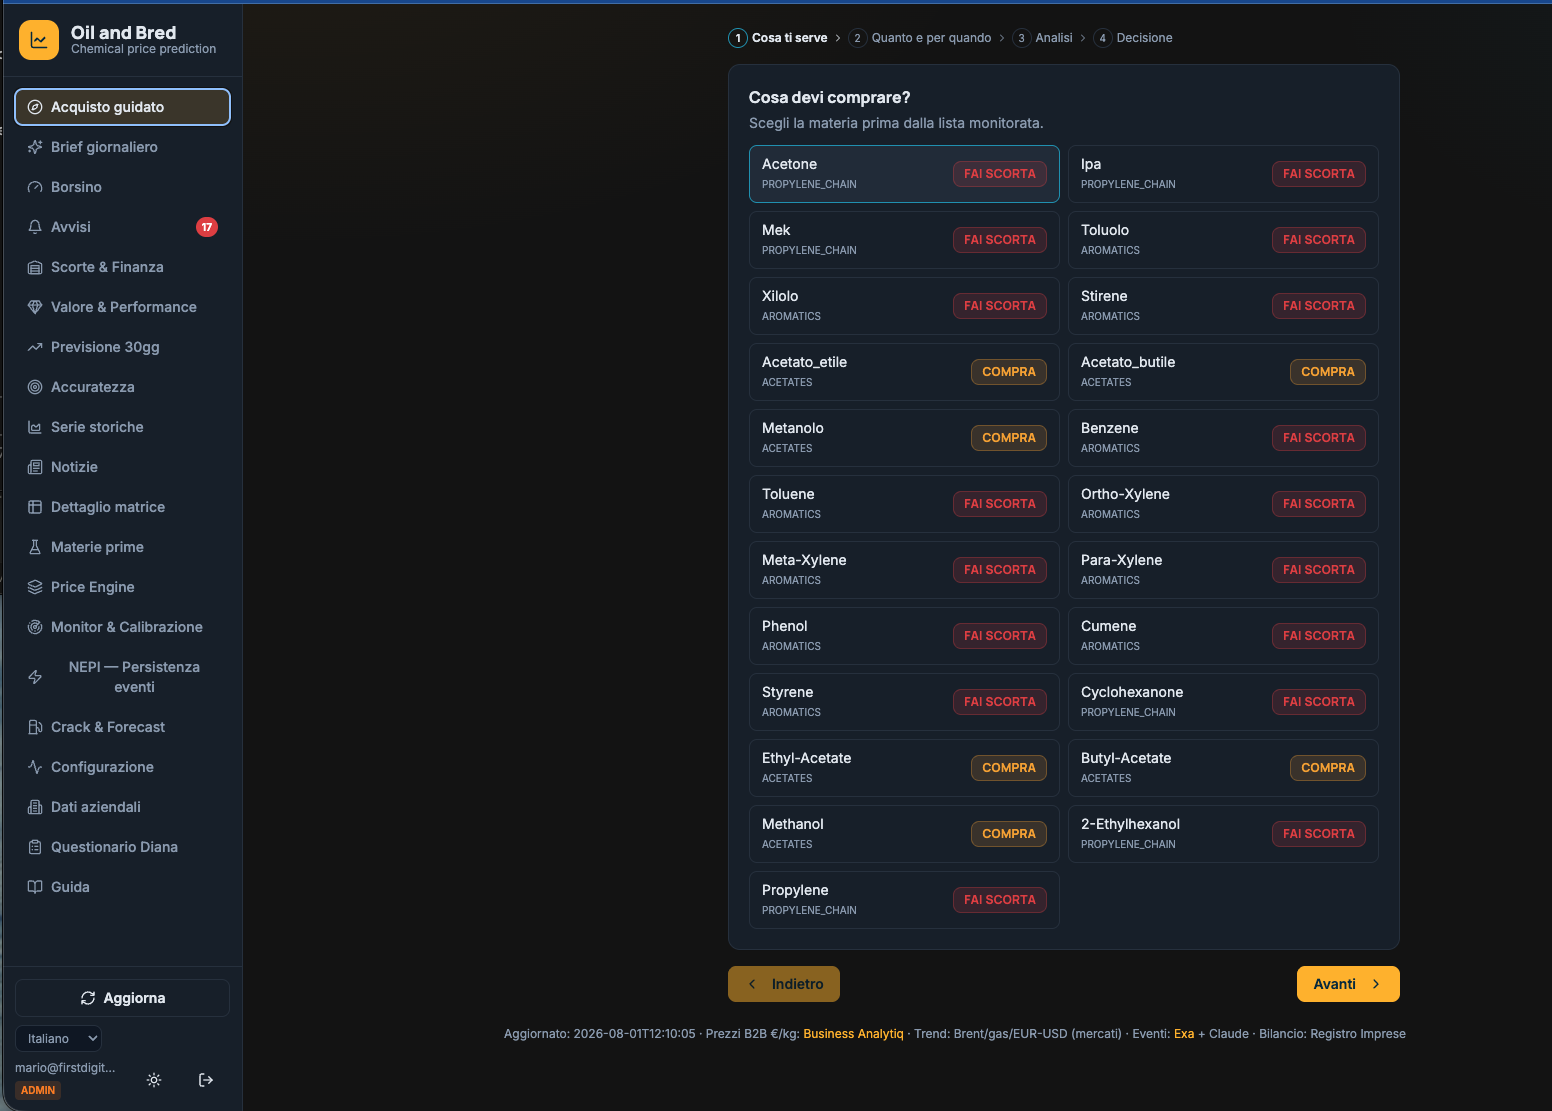 ⤢
⤢Guided purchase
A 4-step wizard: pick the material, enter need and deadline, get a reasoned Go/No-Go with lead time, price and sources.
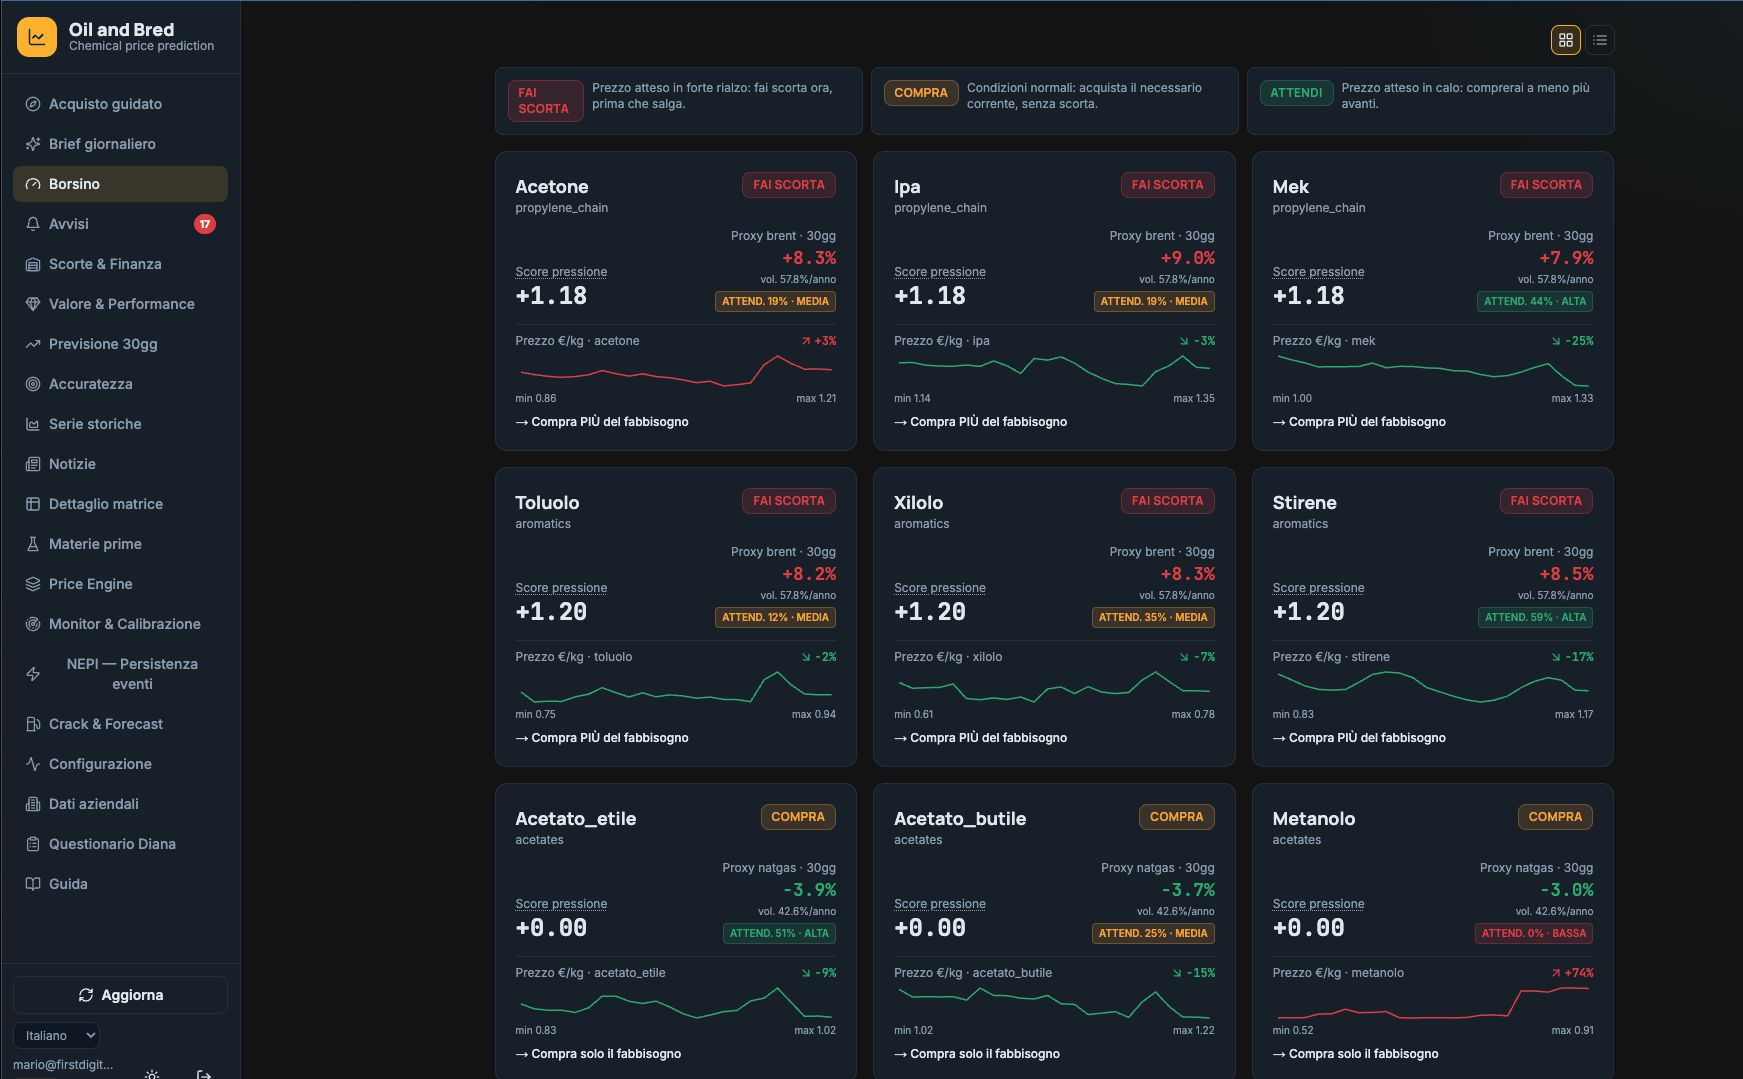 ⤢
⤢Solvent board
Every solvent with signal, pressure score, 30-day forecast, real €/kg price, volatility and reliability — at a glance.
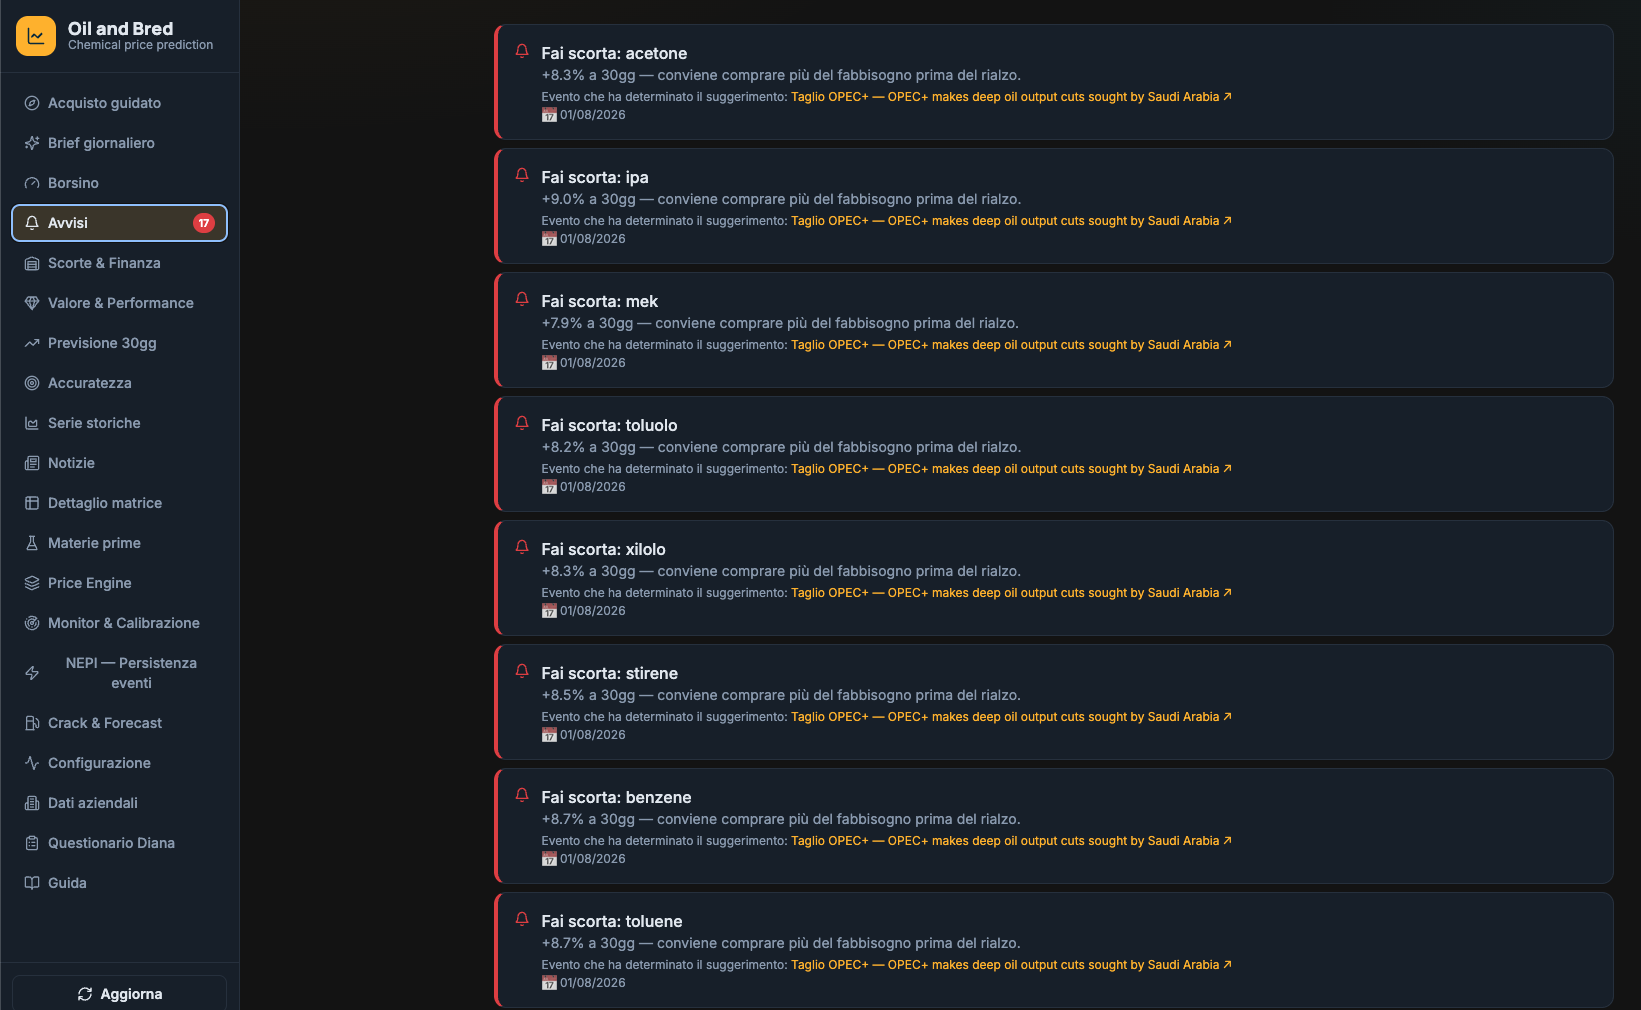 ⤢
⤢Buy alerts
When a “Stock up” fires you also know why: the event that caused it (e.g. an OPEC+ cut), with a link to the source.
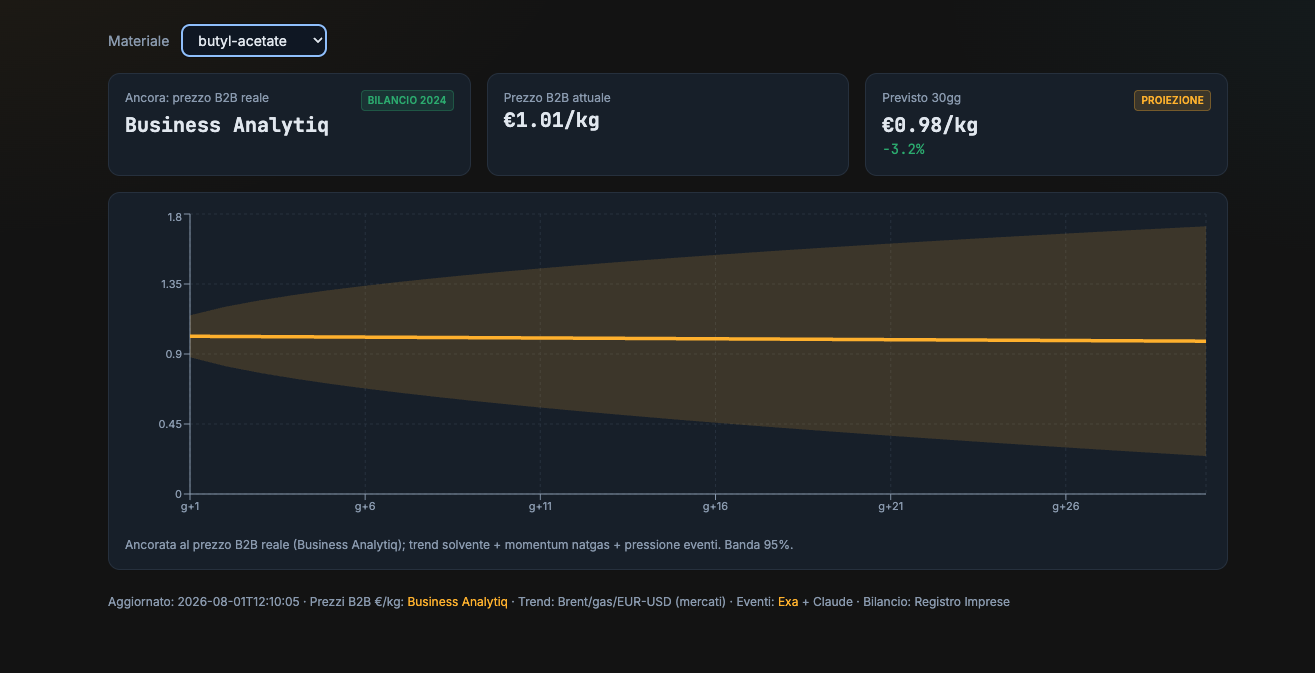 ⤢
⤢30-day forecast
The forecast price anchored to the real B2B price, with a 95% confidence band: you use the range, not just the number.
 ⤢
⤢Verified accuracy
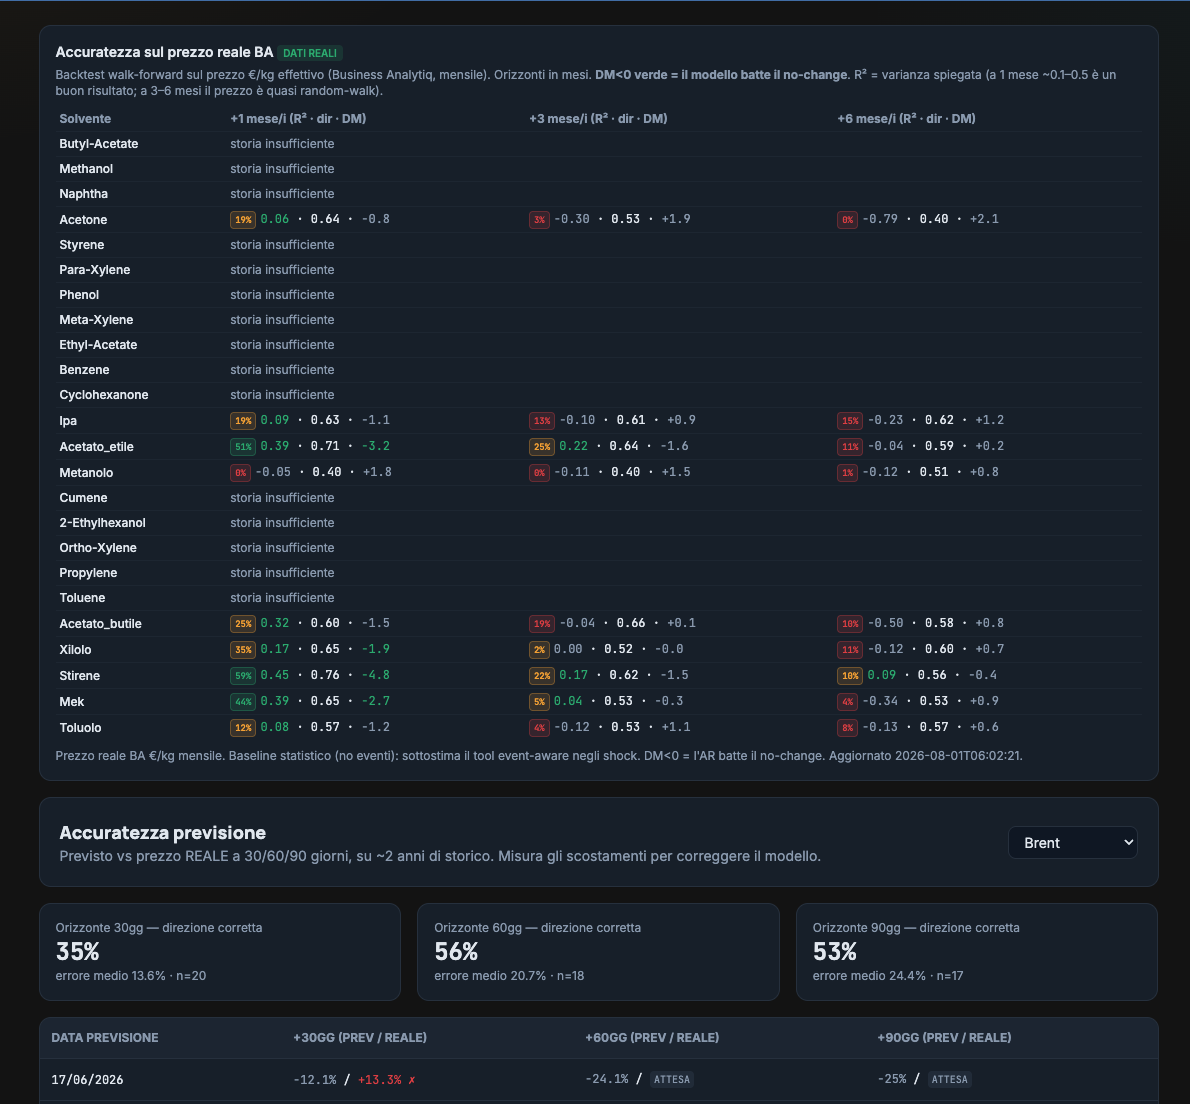
Walk-forward backtest on the real price: direction hit-rate, R², significance (DM). We tell you where we beat no-change and where we don't.
 ⤢
⤢AI-signed events
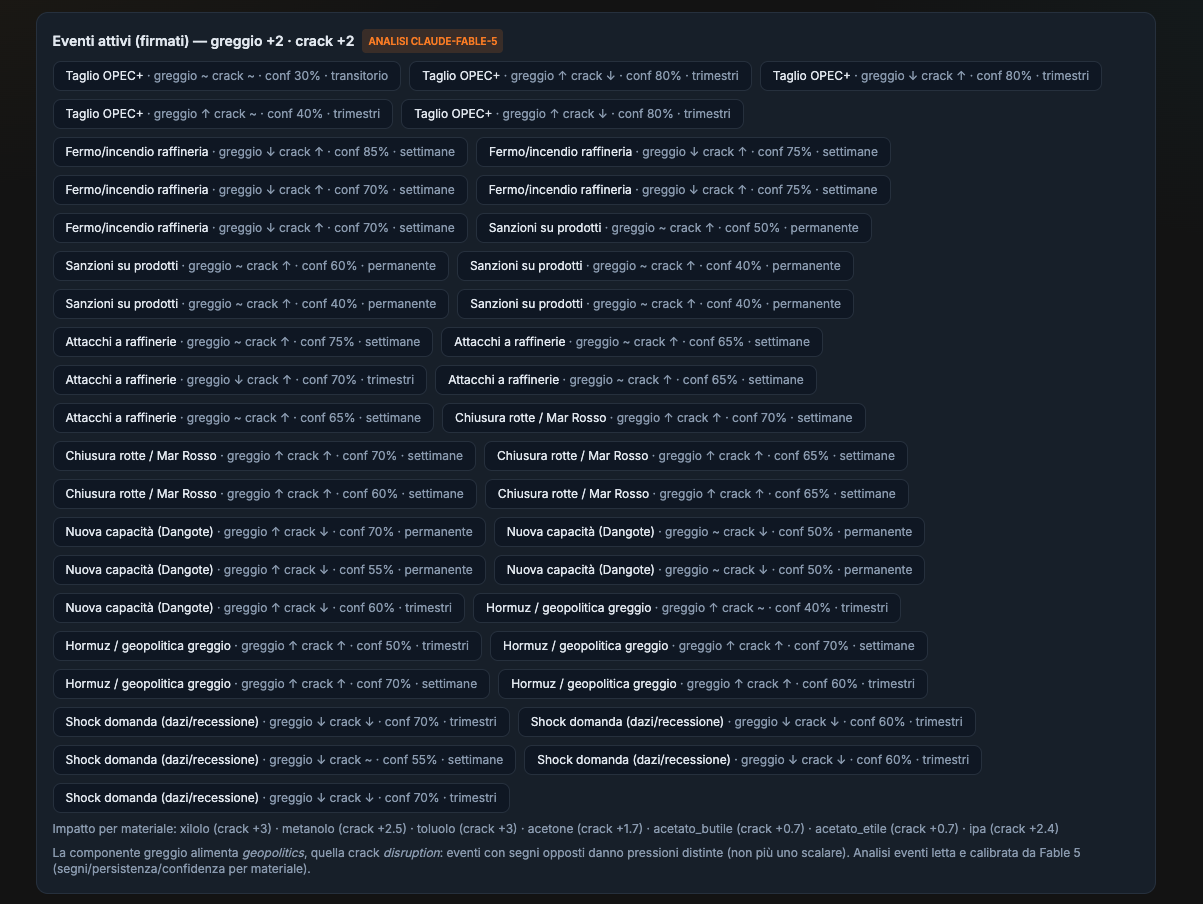
Every event weighted with opposite signs on crude and margin: a refinery outage lifts the crack but lowers crude. Analyzed and calibrated with Claude Fable 5.
 ⤢
⤢Multi-source price
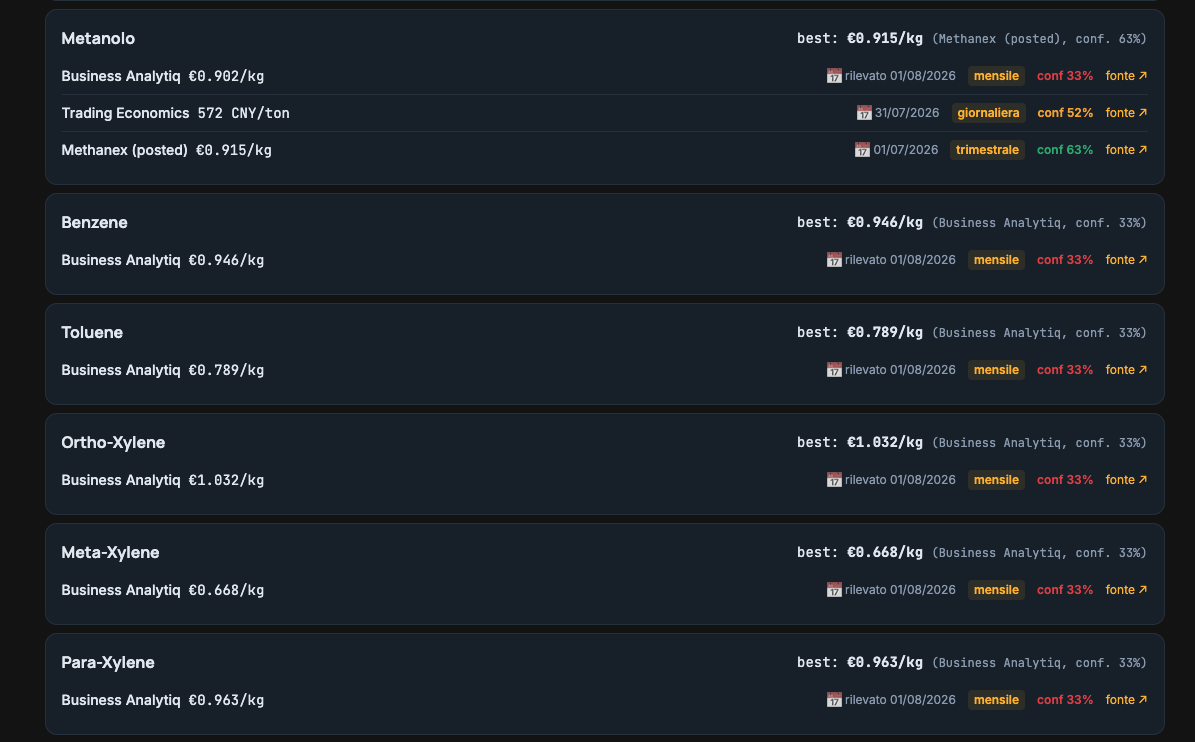
We triangulate several sources (Business Analytiq, Trading Economics, Methanex…) and show the best price with confidence and link. Full transparency.
 ⤢
⤢Monitor & self-calibration
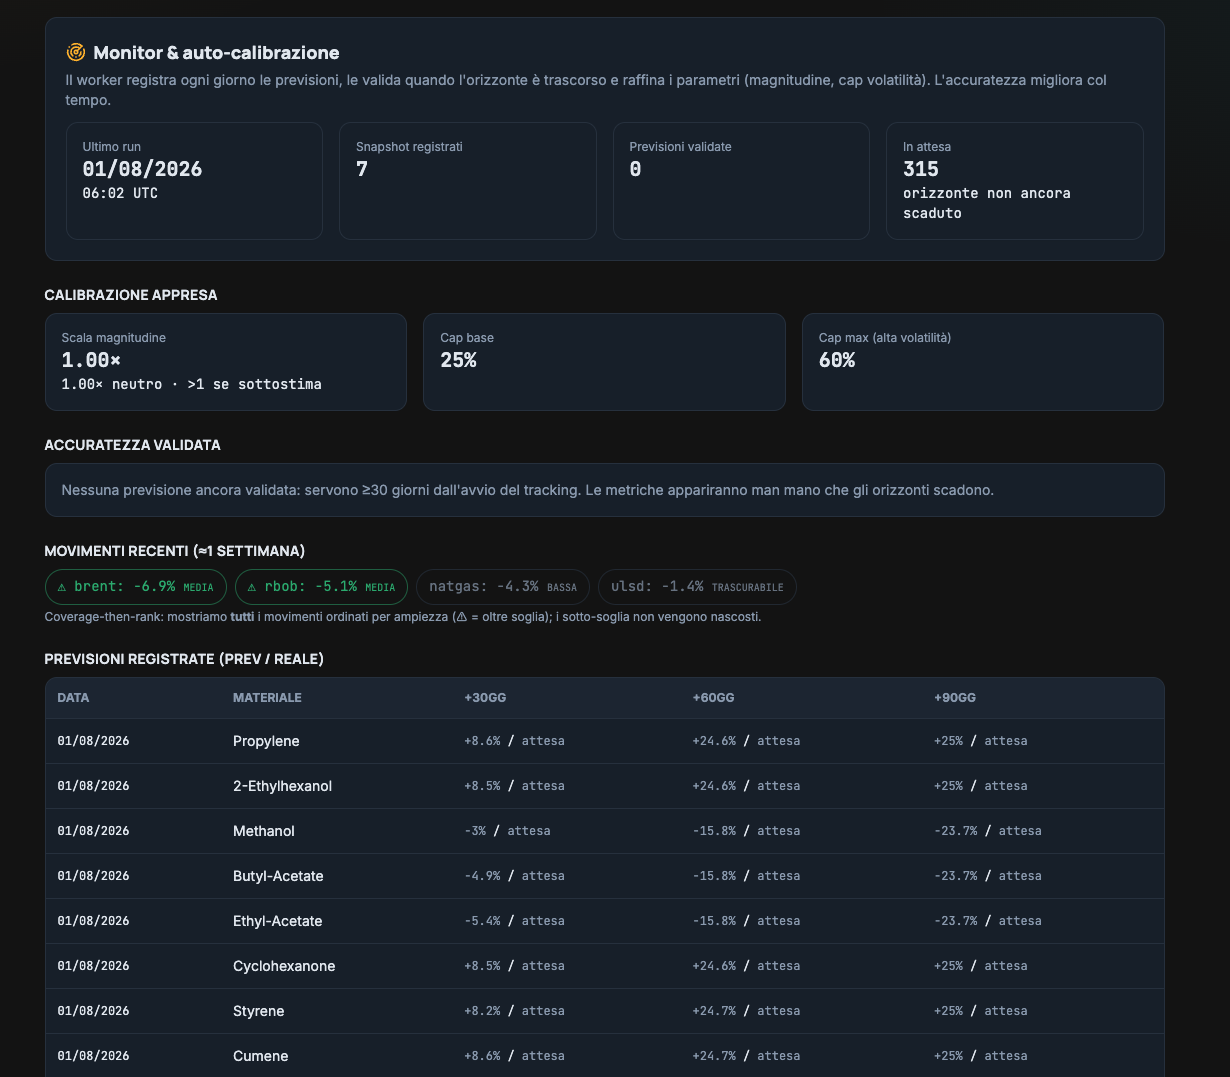
The system logs every forecast, validates it when the horizon elapses and re-calibrates its parameters on its own: accuracy improves over time.
 ⤢
⤢Crack & Forecast
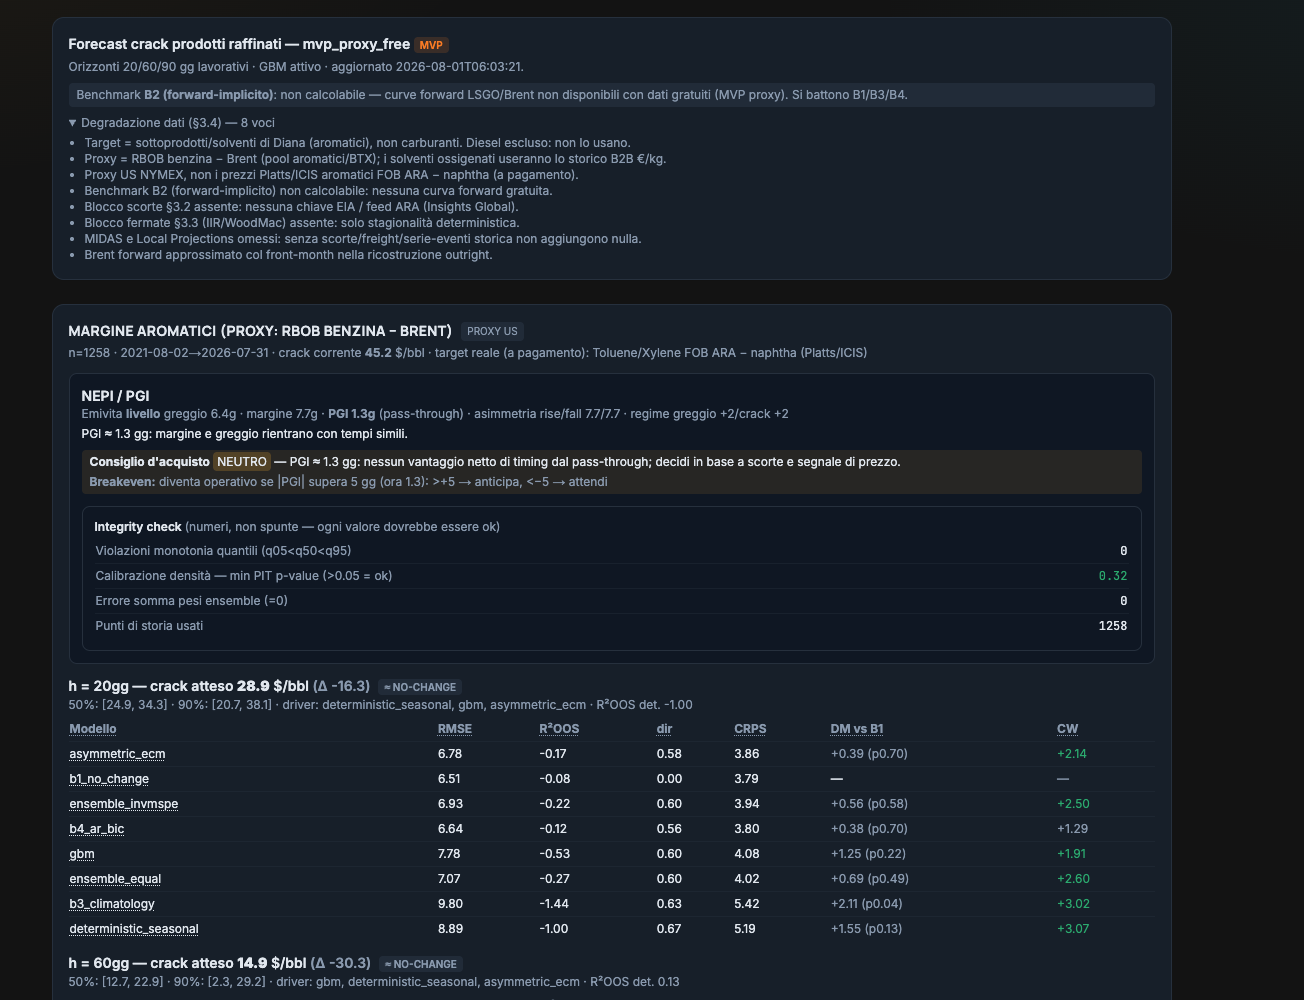
Refined-product margin with 20/60/90-day forecasts, NEPI/PGI indices for timing, integrity checks and honest model benchmarks.
Who is Oil and Bred
If a volatile raw material weighs on your cost of goods and your purchasing has timing leeway, the engine is for you. Here are the sectors.
Immediate fit — solvents & chemicals
- Paints, varnishes and coatings
- Printing inks
- Adhesives and sealants
- Chemical distribution and formulation
- Cosmetics and personal care
- Pharma and APIs
- Resins, polyurethanes, composites
- Plastics and polymers
- Agrochemicals
Strong fit — oil derivatives & energy
- Rubber and tyres
- Lubricants
- Bitumen, asphalt and roads
- Fleets, logistics and transport
- Aviation and shipping
- Plastic packaging
Extendable — volatile commodities
- Food, beverage and feed
- Metals (steel, aluminium, copper)
- Fertilizers
- Textiles and synthetic fibres
- Paper and pulp
Today the engine is calibrated on solvents and oil derivatives; for the other sectors the architecture is the same — you just add the right price series.
How much you can save
Even a 1% saving on material cost — by buying at the right time — is worth multiples of the service price.
Starter
- 1-2 users
- Prices + buy/wait signal
- Daily report
- 1-2 raw materials
Pro
- Multi-user
- Margin & inventory impact
- Backtest + reliability
- Purchase wizard
- All materials
Enterprise
- ERP / API connection
- Multi-plant
- Custom forecast
- SLA + dedicated onboarding
Indicative saving (1–3% of material cost via timing); forecast reliability is measured by backtest. Indicative pricing.
Connect your company ERP
No more estimates: the system feeds on your real data — purchases, stock, bill of materials, actual prices. Forecasts tailored to your company.
Register for buy signals
Free. Every morning prices, buy/wait/stock signals, forecasts with reliability and the news moving the market — in your inbox.
No spam. Unsubscribe anytime. Powered by proprietary algorithms.
Terms & Conditions
Beta software: errors, inaccuracies or service interruptions are possible. Forecasts are decision support, not financial advice, and carry a measured margin of error. Use is at your own risk: EasyTech srl is not liable for any damage, loss or decision made on the basis of the software.
All data sources used are licensed or public.
Product published by EasyTech srl — via Don Bosco 10A, 31021 Mogliano Veneto (TV), Italy. Contact: contact@easytechlab.it
Let's talk: request info
Leave your details: we'll show you how to buy your raw materials better. In a hurry? Tick "call me back now".